Reading the Sidewalk Economy
Today we dive into Street-Level Economic Signals, the everyday cues hidden in windows, sidewalks, and curbsides that reveal how money moves before spreadsheets notice. From chalkboard prices to delivery trucks, we translate small observations into meaningful patterns, share practical field tips, and invite your own notes so together we build a living map of neighborhood demand, resilience, and change without losing nuance, context, or humanity.

Footfall, Lines, and Storefront Vitality
Sidewalk rhythms tell patient stories about demand. Morning bakery lines hint at rising discretionary comfort; late-night corner store visits whisper about necessity. Count strollers versus suit jackets, observe who lingers, and track how quickly windows refresh. One grocer shared that changing displays twice weekly preceded a sales bump, while a rival’s static window signaled tightening cash. Respect privacy, but let patterns, not glances, guide interpretation and help you understand shifting local momentum.
Rapidly changing displays often point to healthy sell-through, tighter inventory management, and a manager testing price elasticity. Note how often signage flips from new arrivals to last-chance markdowns, and whether mannequins rotate seasonally or linger. A dusty prop signals stalled movement; a brisk rotation suggests confident buys. Combine those notes with observed shopper interactions, like touching fabrics or photographing tags, to better frame demand quality without intruding on anyone’s personal space or privacy.
Queues can be deceptive unless timed. A long line with slow staff differs from a steady trickle with lightning-fast service. Measure average wait, pacing, and abandonment when someone leaves mid-queue. Weekend spikes versus weekday steadiness reveal distinct customer mixes and price sensitivity. A coffee shop manager once admitted that when lines pass the second planter, conversion drops; adding a second register restored throughput, loyalty, and tips. Tiny operational tweaks reshape visible signals dramatically and reliably.
Prices on Chalkboards and Shelves
Chalkboards reveal managerial nerve. Frequent edits may reflect volatile costs, assertive revenue testing, or supplier renegotiations. Photograph nothing; just note dates, digits, and direction. Pair with shelf-edge labels: do multi-buy offers expand, and are unit prices shrinking? When a deli pivoted from daily specials to weekly bundles, regulars bought larger baskets. Another café used pencil-thin markdowns to protect premium positioning. Price handwriting, color choices, and placement all hint at confidence, margin pressure, or seasonality-driven experimentation.
Daily Specials as Margin Signals
Specials act like whispers from the back office. Protein-heavy deals on slow days may signal surplus inventory or a supplier discount. Vegetarian bundles after holidays could chase lighter appetites. Track whether specials anchor baskets or siphon from full-price items. A chef once nudged fries into every combo to lift contribution margin without raising headline prices. Regular cadence builds predictable habits, while erratic specials hint at reactive purchasing, revealing stability, foresight, or short-term firefighting behind the counter.
Shrinkflation and Package Sizes on End Caps
End caps brag about value, but watch the ounces. Package downsizing often precedes price hikes or masks cost inflation. Compare historical sizes, placement, and cross-brand swaps. If the largest bag quietly disappears, budgets may be stretching. A corner market traded jumbo cereal for mid-size boxes yet boosted total units sold with two-for deals. Customers felt abundance at checkout, though unit economics shifted. Such subtle moves echo upstream cost shocks and downstream household budgeting under real-world constraints and pressures.


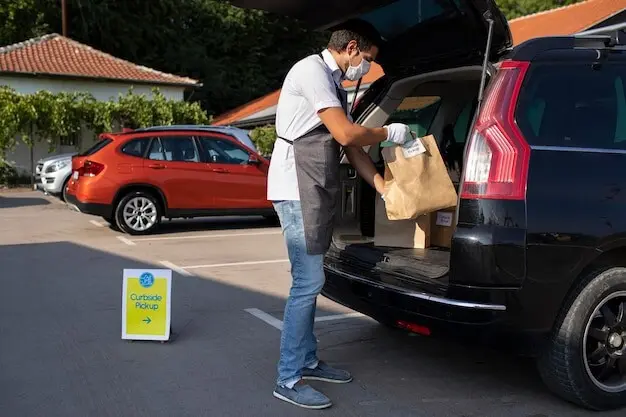
Curbside Logistics as a Demand Barometer
Loading zones, pallets, and cartons quietly measure market pulse. Count deliveries per week, arrival windows, and carrier diversity. Mixed pallets with varied SKUs may indicate experimentation; uniform stacks echo steady sellers. Recycling overflow after holidays frames category winners. Ice and dry-ice bags on sidewalks point to perishables growth or cold-chain stress. A florist receiving dawn deliveries before weddings reveals event momentum returning. Remember to observe from public space, avoid blocking workers, and prioritize safety while gathering cues.
Soundscapes and Service Scripts
What we hear, in public, can outline confidence. Faster greetings signal staffing depth; slower exchanges can betray training gaps. New accent mixes may reflect fresh hires or community inflows. Playlists grow upbeat when managers court linger time. Shorter upsell scripts might acknowledge line anxiety. A bartender swapped complex openers for crisp choices, cutting wait complaints and raising ticket size. Listen ethically from public space, and pair sound cues with observable operations to reduce guesswork and storytelling bias significantly.

Ambient Noise and Peak Period Patterns
Rising volume near lunch aligns with reliable demand; a sudden midafternoon roar could reflect group bookings or school dismissals. Track clatter from dish pits and espresso hissing as proxies for throughput. Less noise might mean slower trade or better insulation. Street musicians outside can lift footfall, while construction noise depresses linger time. One café adjusted seating away from grinders, lengthening stays and pastry add-ons. Sound becomes a measurable variable when your notes are consistent, time-stamped, and comparative.
Languages, Accents, and New-Hire Cadence
Shifts in spoken languages can mirror neighborhood change, seasonal workers, or expanded recruiting. Longer onboarding exchanges at registers indicate fresh training cycles. When multiple staff shadow one experienced cashier, expect slightly slower throughput but stronger retention later. A grocer scheduled bilingual announcements to serve new shoppers and accelerated basket growth without discounting. Treat every observation respectfully; language is identity, not data to mine. Yet, aggregated patterns help decode skills pipelines, onboarding pressure, and service quality confidence over time.
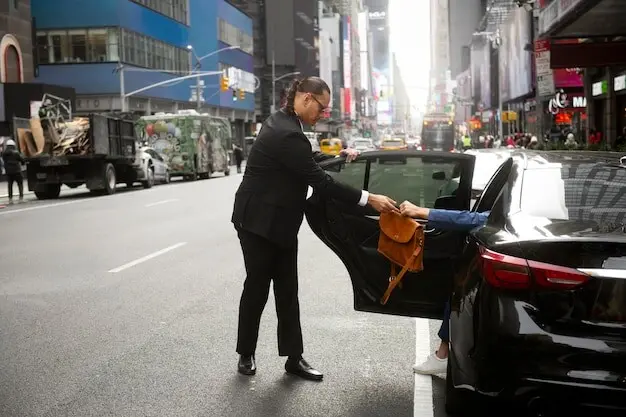
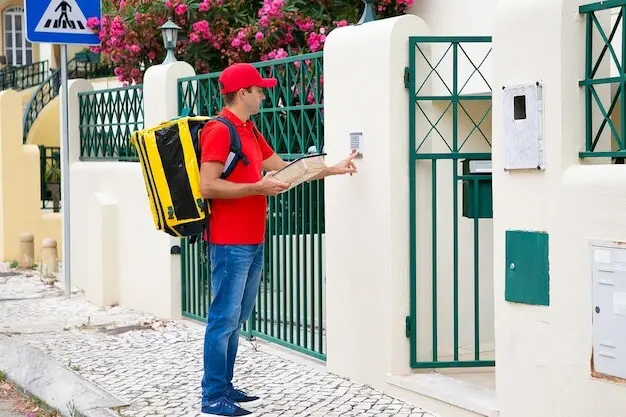
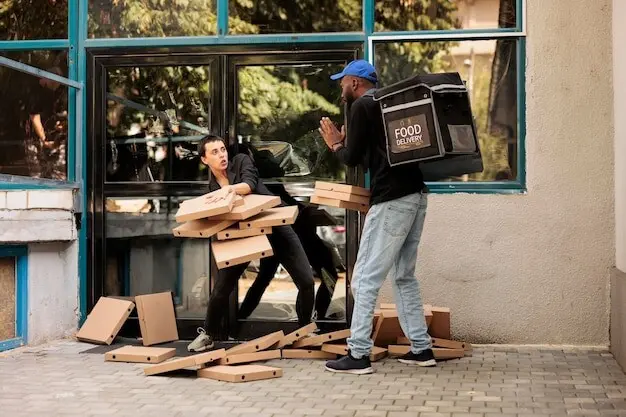
Gig Couriers, Rideshare Queues, and Micro-Warehouses
Courier clusters outline hot kitchens and delivery-led growth. Count branded bags, scooter density, and idle time. Rideshare queues outside venues trace nightlife cycles, hospital staffing shifts, and business travel return. Watch for unmarked storefronts with steady van traffic—micro-warehouses shrinking last-mile distances. One block’s surge of insulated backpacks preceded a cloud kitchen opening by a month. Treat workers with respect, never photograph faces, and focus on aggregates, not individuals, to read demand surges without compromising dignity or trust.
Cash Flow on the Corner
Tip jars, ATM lines, and lottery counters condense community confidence into visible choices. A fuller jar signals gratitude and disposable income; coin-seeking suggests tight weeks. Note cash-only signs, surcharge hikes, and new tap-to-pay terminals. A barber who added QR tips saw bigger weekend spikes. Scratch-off dust near bins correlates with hope on lean days. Share your observations in the comments, subscribe for field guides, and help crowd-map these humble signals into timely, respectful, actionable neighborhood intelligence.
The clink and rustle around counters reflects mood. When baristas celebrate tips with a short jingle, contributions often rise, especially during cheerful rush hours. Watch cash-to-coin ratios and whether jars migrate to more visible spots. One café split jars by charity, doubling participation. Consider seasonality—cold snaps lift hot drink tips. Combine these notes with observed staffing and queue speed to isolate generosity from service quality, keeping interpretations humble, people-first, and tethered to consistent, time-stamped observation habits.
A growing evening ATM line may reflect nightlife cash habits or stalled card terminals. Track surcharge increments; owners adjust when processor costs jump. Cash-only pivots during outages hint at fragile infrastructure. A food truck added a portable reader and broadened clientele instantly. New tap-to-pay decals point to investment confidence. Watch for armored car schedules too; tighter pickups can mirror rising volumes. Pair these signals with local event calendars to separate habit-driven spikes from structural changes in payment behavior.
When scratchers sell briskly near paycheck dates, households may chase quick upside under budget stress. Note multi-ticket bundles, game variety, and whether retailers reorder faster. A shopkeeper shifted the display behind glass to manage demand surges while keeping trust. Dust around dispensers indicates heavy use; cleaner counters imply steady but slower turns. Treat such cues sensitively; they carry emotion. Fold them into broader baskets, not snap judgments, to understand how communities navigate uncertainty and aspiration during uneven cycles.