
Reading the Pulse of Urban Rides
Signals That Speak Before Words
From Tap to Trip: Microbursts of Demand
A thousand tiny taps can synchronize within minutes after a downpour, shift change, or train delay. Those clustered requests briefly outpace available cars, lifting multipliers and stretching ETAs. The best operators anticipate these microbursts by watching cadence, not just counts, then move early. Share a moment you successfully predicted an incoming wave and how that shaped your ride decision, patience, or routing choice when the city’s rhythm suddenly quickened.
The Curbside Telegraph
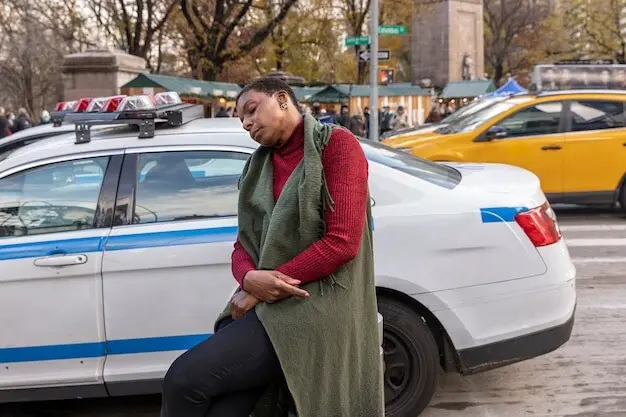
Taxi queues broadcast a public, legible message that even passersby can decode: long lines of cabs often mean reliable pickup but thin rider flow, while sparse ranks signal scarcity and likely higher willingness to pay. Drivers triangulate with hotel doormen, bellhops, and event staff to refine intuition. Describe how a single glance at a rank or holding bay changed your plan, and whether the visible line matched what the apps predicted that hour.
Weather, Events, and Human Rhythms
Rain, heat waves, delayed kickoffs, and last-song encores push people into or out of streets in patterned pulses. These rhythms shape not only multipliers and queue length, but also who rides, how far, and how urgently. Practiced drivers log local quirks and seasonal behaviors; savvy riders learn to time departures. What patterns in your city repeatedly catch newcomers by surprise, and which subtle cues help you leave five minutes earlier to beat the inevitable spike?
Inside the Multiplier
Airports, Stadiums, and the Long Line
Virtual Queues Versus Physical Queues
Airports often combine holding lots, geofences, and app-based tokens to emulate curbside fairness without endless idling. Physical ranks remain intuitive, but virtual lists can reward patience and reduce deadhead miles. Yet rules must be clear: restrooms, meal breaks, and reentry matter. Tell us which approach delivered smoother flow in your city, how rebalancing worked when flights bunched, and what you would change to protect both service quality and driver dignity during peak surges.
Holding Lots and Deadhead Miles
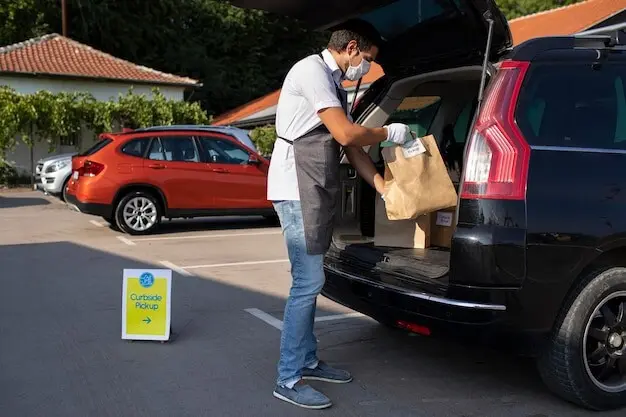
Time in a holding lot seems free until fuel, opportunity cost, and fatigue accumulate. Strategically leaving to chase neighborhood surge can backfire if reentry penalties or traffic erase gains. Good systems surface expected wait, acceptance bonuses, and nearby alternatives. Share a decision that saved your shift, or one that taught humility, and suggest data points that would help future drivers judge whether to stay, split the difference, or cut losses before the next arrival bank.
Event Exits and Crowd Management
After a final whistle or encore, thousands seek rides simultaneously, magnifying frictions at curbs, intersections, and loading zones. Temporary pickup areas, one-way flows, and clear zone codes can dramatically reduce chaos. Apps that stagger release times preserve trust. What signage, ushers, and prompts actually worked where you live? Recommend low-cost changes that made families feel safer, drivers more respected, and police less stressed when a joyful night risked devolving into horns, standstills, and frayed tempers.
Rider Perception and Willingness to Pay
Willingness to pay changes with urgency, weather, group size, and alternatives. Clear framing helps: is the extra cost buying speed, reliability, or safety? Prompts suggesting transit when prices spike can earn goodwill. What messages convinced you to wait or walk, and which felt pushy? Describe how your decision calculus shifted when the map showed rain bands approaching, and whether transparent explanations softened frustration when the multiplier rose precisely as your battery hit five percent.
Driver Choice Architecture
Choice design shapes outcomes before the first mile: queue visibility, heatmap granularity, and earnings forecasts influence whether drivers chase surge or hold steady. Presenting realistic estimates, not best-case screenshots, strengthens trust. What small UI elements helped you plan a shift? We welcome mockups, annotated photos, or scripts that explain acceptance trades, cancellation thresholds, and quiet-period guarantees without jargon, so people feel guided rather than herded when the city’s pulse speeds up unexpectedly.
Equity and Accessibility
Signals can inadvertently sideline those with slower phones, limited data, or disabilities who cannot sprint to a designated zone. Curb design, audio prompts, and parity safeguards are essential. How should systems prioritize wheelchair-accessible vehicles during peaks without punishing earnings? Propose ways to surface community needs in real time, translate policy goals into gentle nudges, and measure whether interventions actually help people who most depend on reliable, affordable trips when conditions become demanding and confusing.
Policy, Streets, and the City Clock
Congestion, Emissions, and Curb Rights
Data Sharing Compacts
Pricing Caps and Experimentation