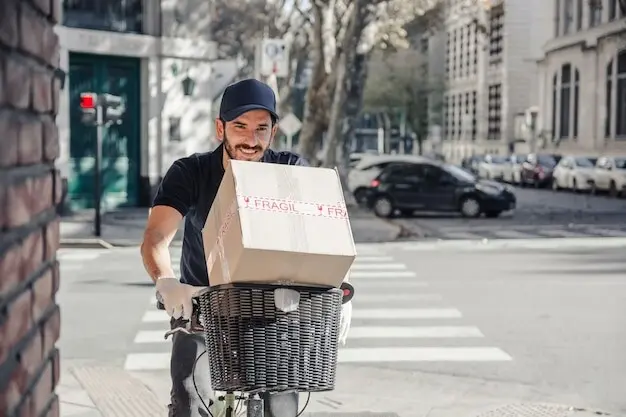
Vans, Curbs, and Boxes: Reading the Urban Pulse

From delivery vans threading narrow streets to curbside pickups scheduled by impatient phones, and the rising tide of package volume at doorways, we reveal how these visible movements indicate urban commerce. We introduce delivery vans, curbside pickups, and package volume as practical signals that map demand surges, operational bottlenecks, neighborhood vitality, and policy effects, translating street scenes into understandable economic stories.

Street-Level Signals of Demand

Watch intersections, alleys, and loading doors, and a quiet dataset begins to speak. The cadence of delivery vans, the turnover of curbside pickups, and the sheer package volume combine into a readable market pulse, illuminating who buys, when they buy, and how logistics stitches everything together across blocks.

Collecting Evidence Without Getting in the Way

Reliable insight requires careful observation that respects busy streets and privacy. Blend manual tallies with lightweight sensors and responsibly configured computer vision to capture delivery vans, curbside pickups, and package volume patterns, focusing on aggregates, not identities, so conclusions guide better design rather than surveillance.

Clipboards, Apps, and Good Shoes

Simple sampling works: five minutes each hour, two days per week, rotating corners. Note vehicle type, dwell time, pickup completion, and package counts. A shared spreadsheet or quick mobile form turns scattered observations into trustworthy baselines that support comparisons across changing seasons and policies.

Edge Sensors at the Curb

Magnetometers, overhead counters, and curb occupancy meters record motion without storing personal data. Sampled in short bursts, they surface peaks, slack periods, and anomalies that correlate with promotions or service hiccups. Calibrate often, annotate events, and always publish collection methods for credibility and reuse.

Stories From the Sidewalk

Numbers gain meaning when paired with lived experience. Short field notes about delivery vans dodging scooters, curbside pickups colliding with school dismissal, and package volume ballooning after regional storms add texture, reveal causes behind spikes, and humanize the pressures hidden inside logistics dashboards.

The Bakery at Dawn

At 6:30 a.m., three vans arrived within nine minutes, unloading flour and boxes of branded cups while cyclists squeezed past. By eight, curbside pickups formed a steady line. By noon, packaging waste overflow hinted at online preorders driving unexpected sandwich popularity.

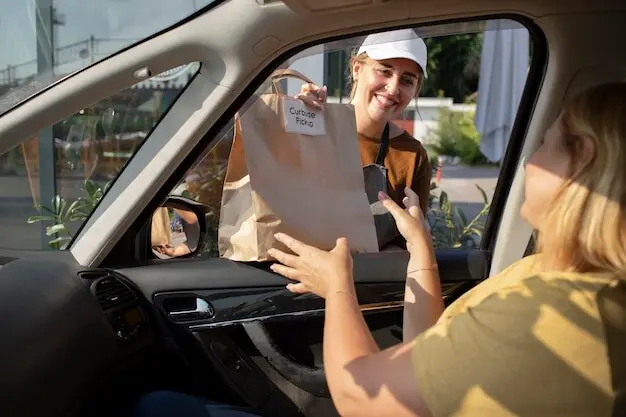
A Boutique Learns the Rush

The pop-up on Cedar misjudged lunch demand. Vans kept missing the narrow delivery window, colliding with customers queued for pickups. After shifting restocks to midafternoon and designating two quick-turn curb spaces, receipts rose, tempers cooled, and returns dropped because sizes could be exchanged immediately.
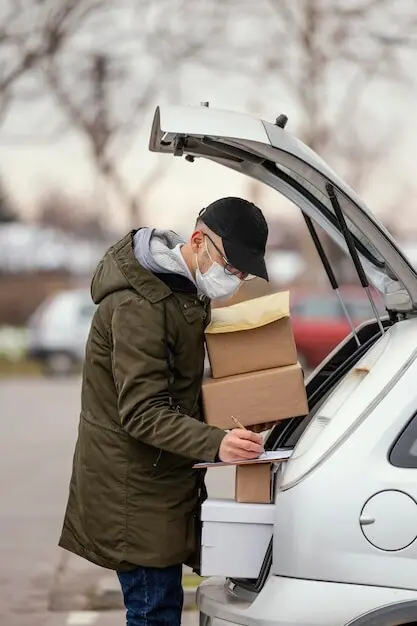
After the Storm

A regional outage grounded flights and slowed highways, yet package volume at apartment lobbies spiked two days later as backlogged orders landed all at once. Door attendants logged extended hours, while curbside pickups doubled, revealing pent-up demand surfacing in a compressed burst.

Policy, Logistics, and the Battle for Curb Space

Commercial corridors juggle buses, bikes, deliveries, ride-hails, and neighbors needing daylight and quiet. Measured patterns of vans, pickups, and package volume can justify loading zones, microhubs, cargo-bike incentives, and enforcement schedules that speed commerce while protecting safety, accessibility, and air residents actually want to breathe.

Loading Zones that Work

Designate curb segments with clear hours, bold signs, and camera-free sensors publishing occupancy in real time. Merchants coordinate deliveries to open windows, drivers avoid fines, and sidewalks stay passable. Fewer chaotic stops reduce crash risk and shorten everyone’s trip times noticeably.

Microhubs and Cargo Bikes

Transferring parcels from vans to electric cargo bikes inside small neighborhood depots slashes double-parking and improves delivery reliability. Package volume becomes more predictable, curbside pickups face less interference, and storefronts enjoy quieter blocks where shoppers linger instead of dodging mirrors and tailpipes.

Dynamic Rules, Real Results

Adjust loading durations by time of day, pricing by occupancy, and enforcement by measured risk. Publish dashboards that tie delivery van counts, curbside pickup turnover, and package volume to travel times and crashes, so residents see trade-offs and support pragmatic, data-guided changes.

Designing Seamless Pickups and Deliveries

Clear signage, intuitive apps, lighting that invites safety, and curb heights that welcome strollers and wheelchairs turn chaotic exchanges into fluid choreography. When delivery vans glide, curbside pickups finish quickly, and package volume flows predictably, retail feels effortless and neighbors feel respected rather than disrupted.

Forecasting the Next Rush

Signals That Lead Sales

Delivery data often jumps before receipts. Sudden van clusters or swelling package piles can foreshadow a viral product, a successful ad, or a fresh competitor. Acting early, retailers adjust staffing and shelf space while carriers reshuffle routes to protect on-time performance.

Weekparts and Dayparts

Weekends whisper different stories than Mondays. Compare pre-work pickups, lunch surges, school-dismissal chaos, and late-night residential deliveries to craft schedules that match reality. Packaging your own playbook from recurring patterns prevents burnout and turns stressful crunches into predictable, surprisingly satisfying routines.

Holidays Without Headaches

Use last year's van counts and package curves to stage temporary microhubs, extend pickup hours, and increase staff near hot corners. Forecasted pressure makes cheery storefronts possible, even as boxes stack high and sidewalks fill with hurried shoppers seeking promised doorstep magic.

Join the Count: Share Your Street

Your observations add clarity impossible to purchase. Snap structured notes about delivery vans, report curbside pickup wait times, and estimate package volume at building lobbies, then compare with neighbors. Share anomalies, subscribe for monthly insights, and suggest blocks we should study next together.
Sirasanozavofari
Privacy Overview

This website uses cookies so that we can provide you with the best user experience possible. Cookie information is stored in your browser and performs functions such as recognising you when you return to our website and helping our team to understand which sections of the website you find most interesting and useful.